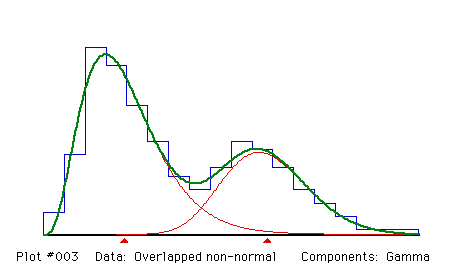
This histogram was artificially constructed by shifting the right-hand component of the previous histogram 5 units to the left.
Gamma components, unconstrained.
This is an excellent fit. The estimates are very close to their true values.

 Fitting Gamma components

 Proportions and their standard errors
    .65054    .34946
    .04478    .04478

 Means and their standard errors
    3.9019   10.7319
     .2746     .3286

 Sigmas and their standard errors
    1.9337    2.0720
     .2605     .2311

 Degrees of freedom = 16 - 1 +   0 -  0 -  5 -   0 =  10

 Chi-squared =  3.18914            (P =  .9766)
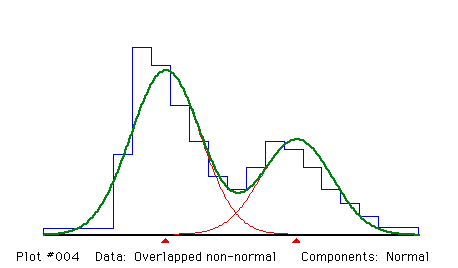
Normal components, with the two standard deviations constrained to be equal.
A poor fit, but the estimates themselves are excellent.

 Fitting Normal components

 Proportions and their standard errors
    .63254    .36746
    .03175    .03175

 Means and their standard errors
    3.7311   10.6590
     .1604     .2182

 Sigmas (EQUAL) and standard error
    1.8396    1.8396
     .0963

 Degrees of freedom = 16 - 1 +   0 -  0 -  4 -   0 =  11

 Chi-squared =  17.7339            (P =  .0880)
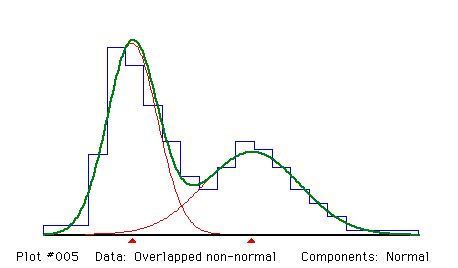
Normal components, unconstrained.
Information about skewness is lost in the overlap. The result is an excellent fit to the mixture distribution, at least according to the goodness-of-fit test, but the estimates are badly biased. In particular, the proportion and the standard deviation of the first component are under-estimated while those of the second component are over-estimated.

 Fitting Normal components

 Proportions and their standard errors
    .55082    .44918
    .04397    .04397

 Means and their standard errors
    3.3582    9.8720
     .1615     .4059

 Sigmas and their standard errors
    1.3787    2.5906
     .1250     .3028

 Degrees of freedom = 16 - 1 +   0 -  0 -  5 -   0 =  10

 Chi-squared =  4.58181            (P =  .9173)